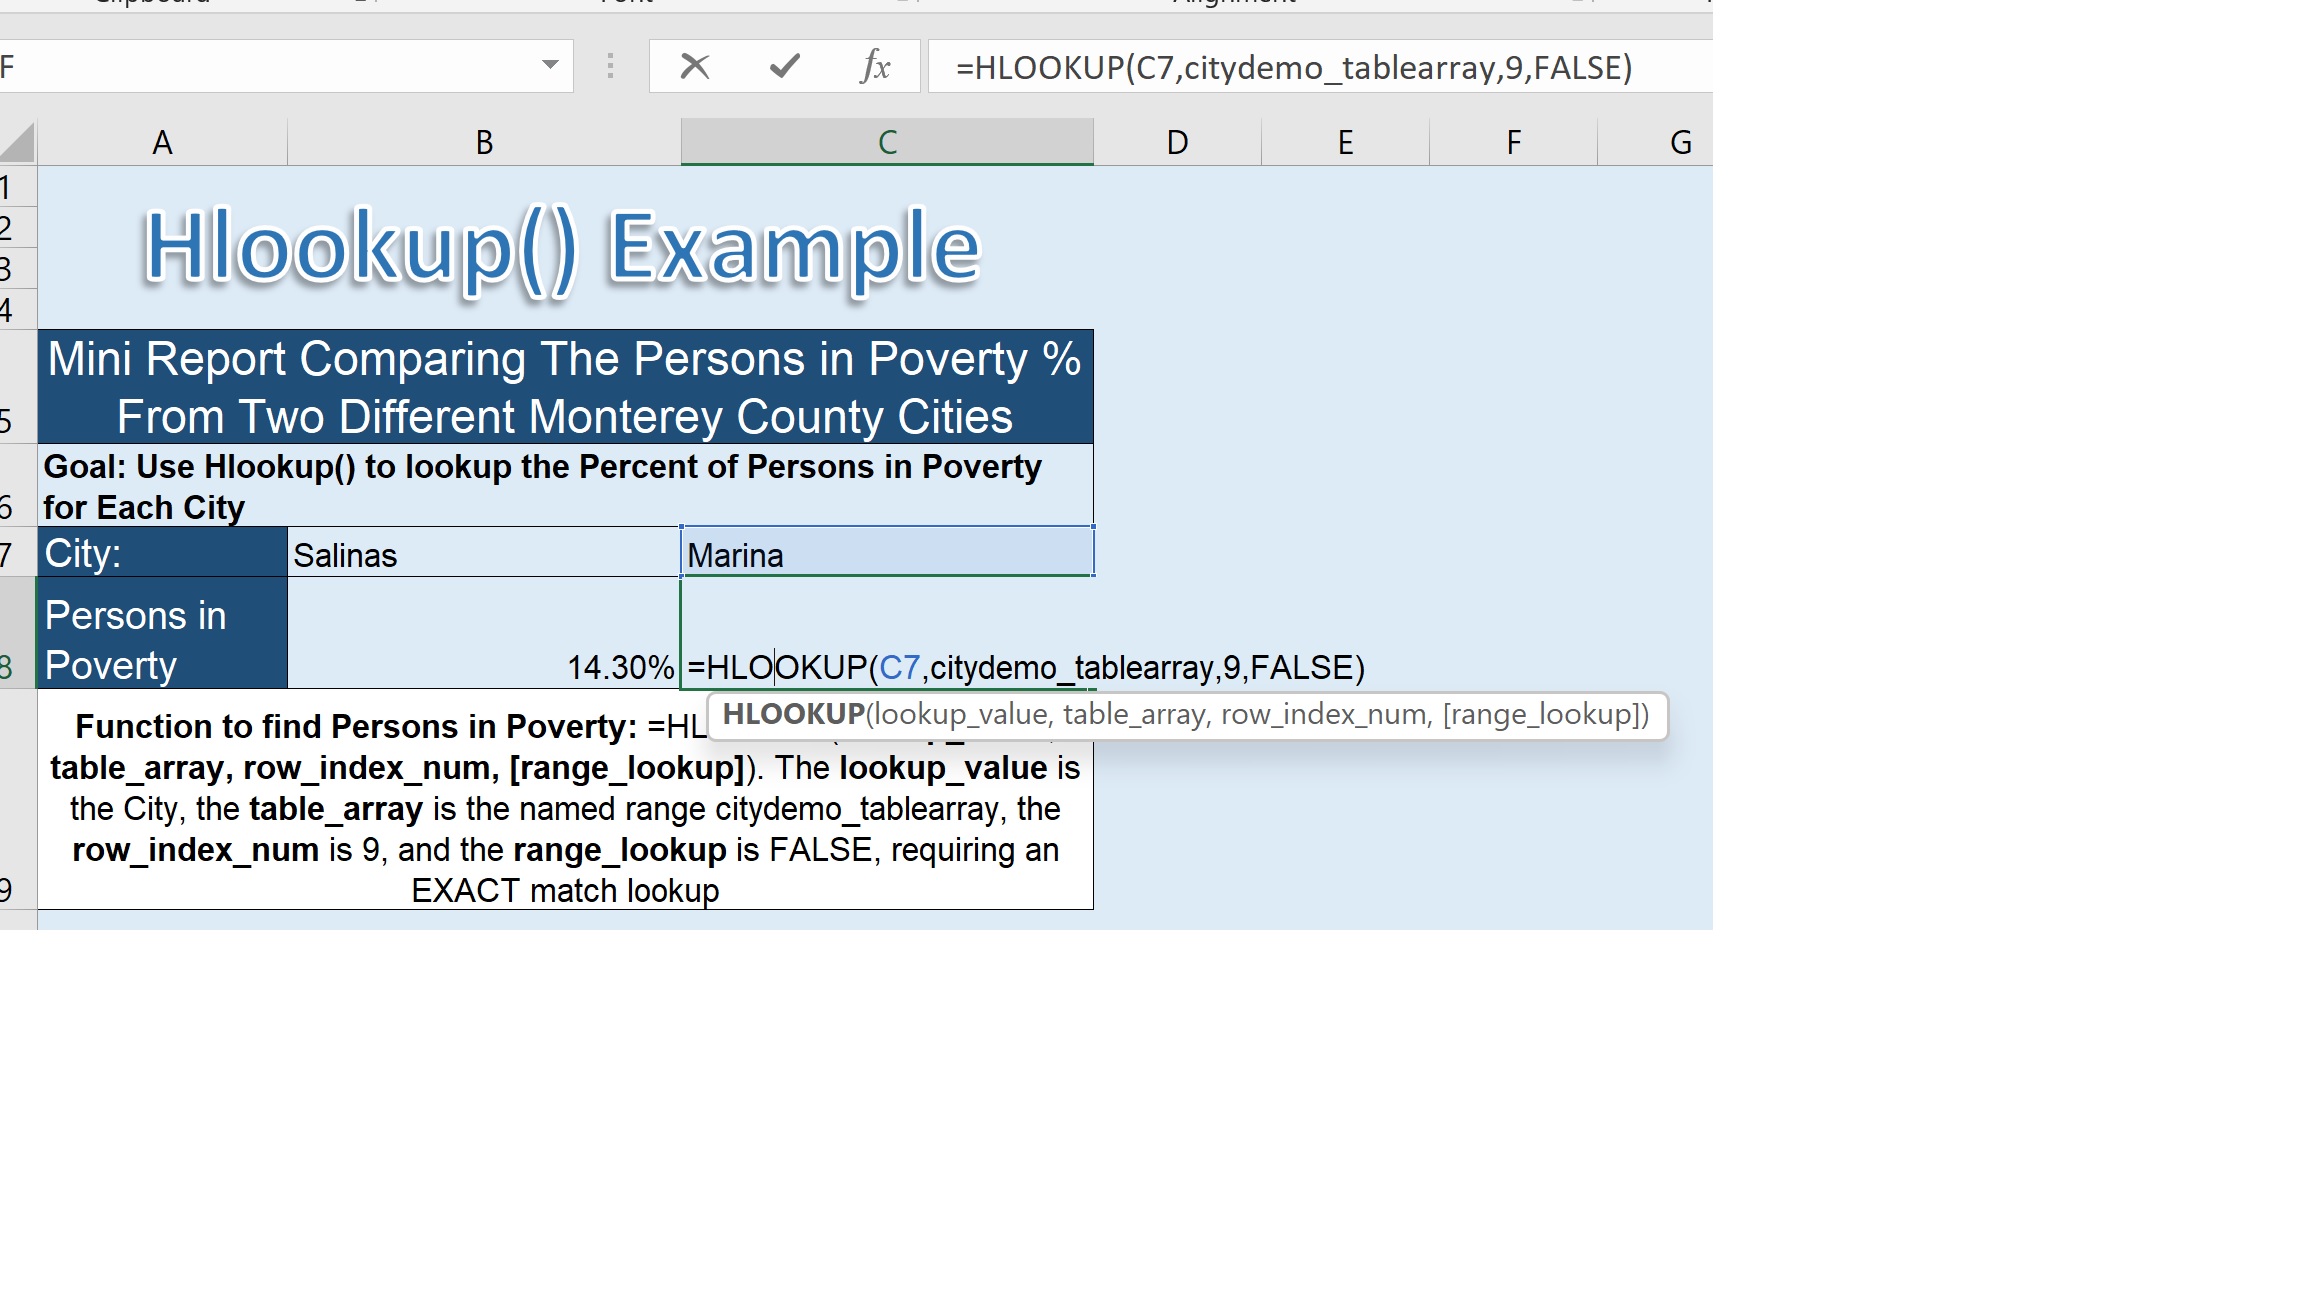
We’re going to look first at the definition of the Hlookup() Function.
The Hlookup() Function is a horizontal lookup, as opposed to the Vlookup() which is a vertical lookup. So, the horizontal lookup looks across a row for a match to the Lookup Value. It looks for the Lookup Value in the top row of a Table Array, and once it finds a match to that Lookup Value, then it uses the Row Index Number, to go down to the correct row in that same column where the match was found, and return a value as the result of the function. The RANGE Lookup argument tells whether we’re looking for an EXACT match or a RANGE match. If the RANGE lookup argument is FALSE, we’re looking for an EXACT match. So now, we’ll look at the Hlookup() Example worksheet and see what our scenario is. Here we have a mini report that’s comparing the Percent of Persons in Poverty in two different Monterey County cities, according to demographic data gathered in the 2021 U.S census. And we see that the Hlookup() Function uses the name of the city as its Lookup Value. A Table Array called City Demo Table Array, to search for that name. The Row Index Number given is row 9, and it’s RANGE Lookup argument is FALSE, which means we’re looking for an EXACT match. So let’s take a look at that City Demo Table Array. It’s on a worksheet named City Demographics.
And here you can see the cities are stored in the first row of the table. And we’ll select the whole table array by choosing City Demographics, actually it’s called
City Demo Table Array. So the area selected has the city names in the top row, and then values for all of these different categories in the rows below going down to row 9, which is “Persons in Poverty.” So let’s say we were trying to match the city “Monterey.”
That match would need to be found in row 1 of the table, and then going down 2,3,4,5,6,7,8,9, row 9 of the table would be finding the cell with “Persons in Poverty” associated with the city of “Monterey.” So, if we look back at the
function we see that that is the same result that we get using the Hlookup() Function. If we choose a different city from this drop down list,
then we’ll get a different value. For Marina it was 10.2%. If we go back to the table, let’s take a look. Here’s the city of Marina, and we see that down there in row 9 is 10.2%.
Thank you very much!

