
download your own copy of this workbook so you can see all of the illustrations in your own workbook
and browse around to the different worksheets. We’re going to jump to the Nested If Strategy 1
worksheet.
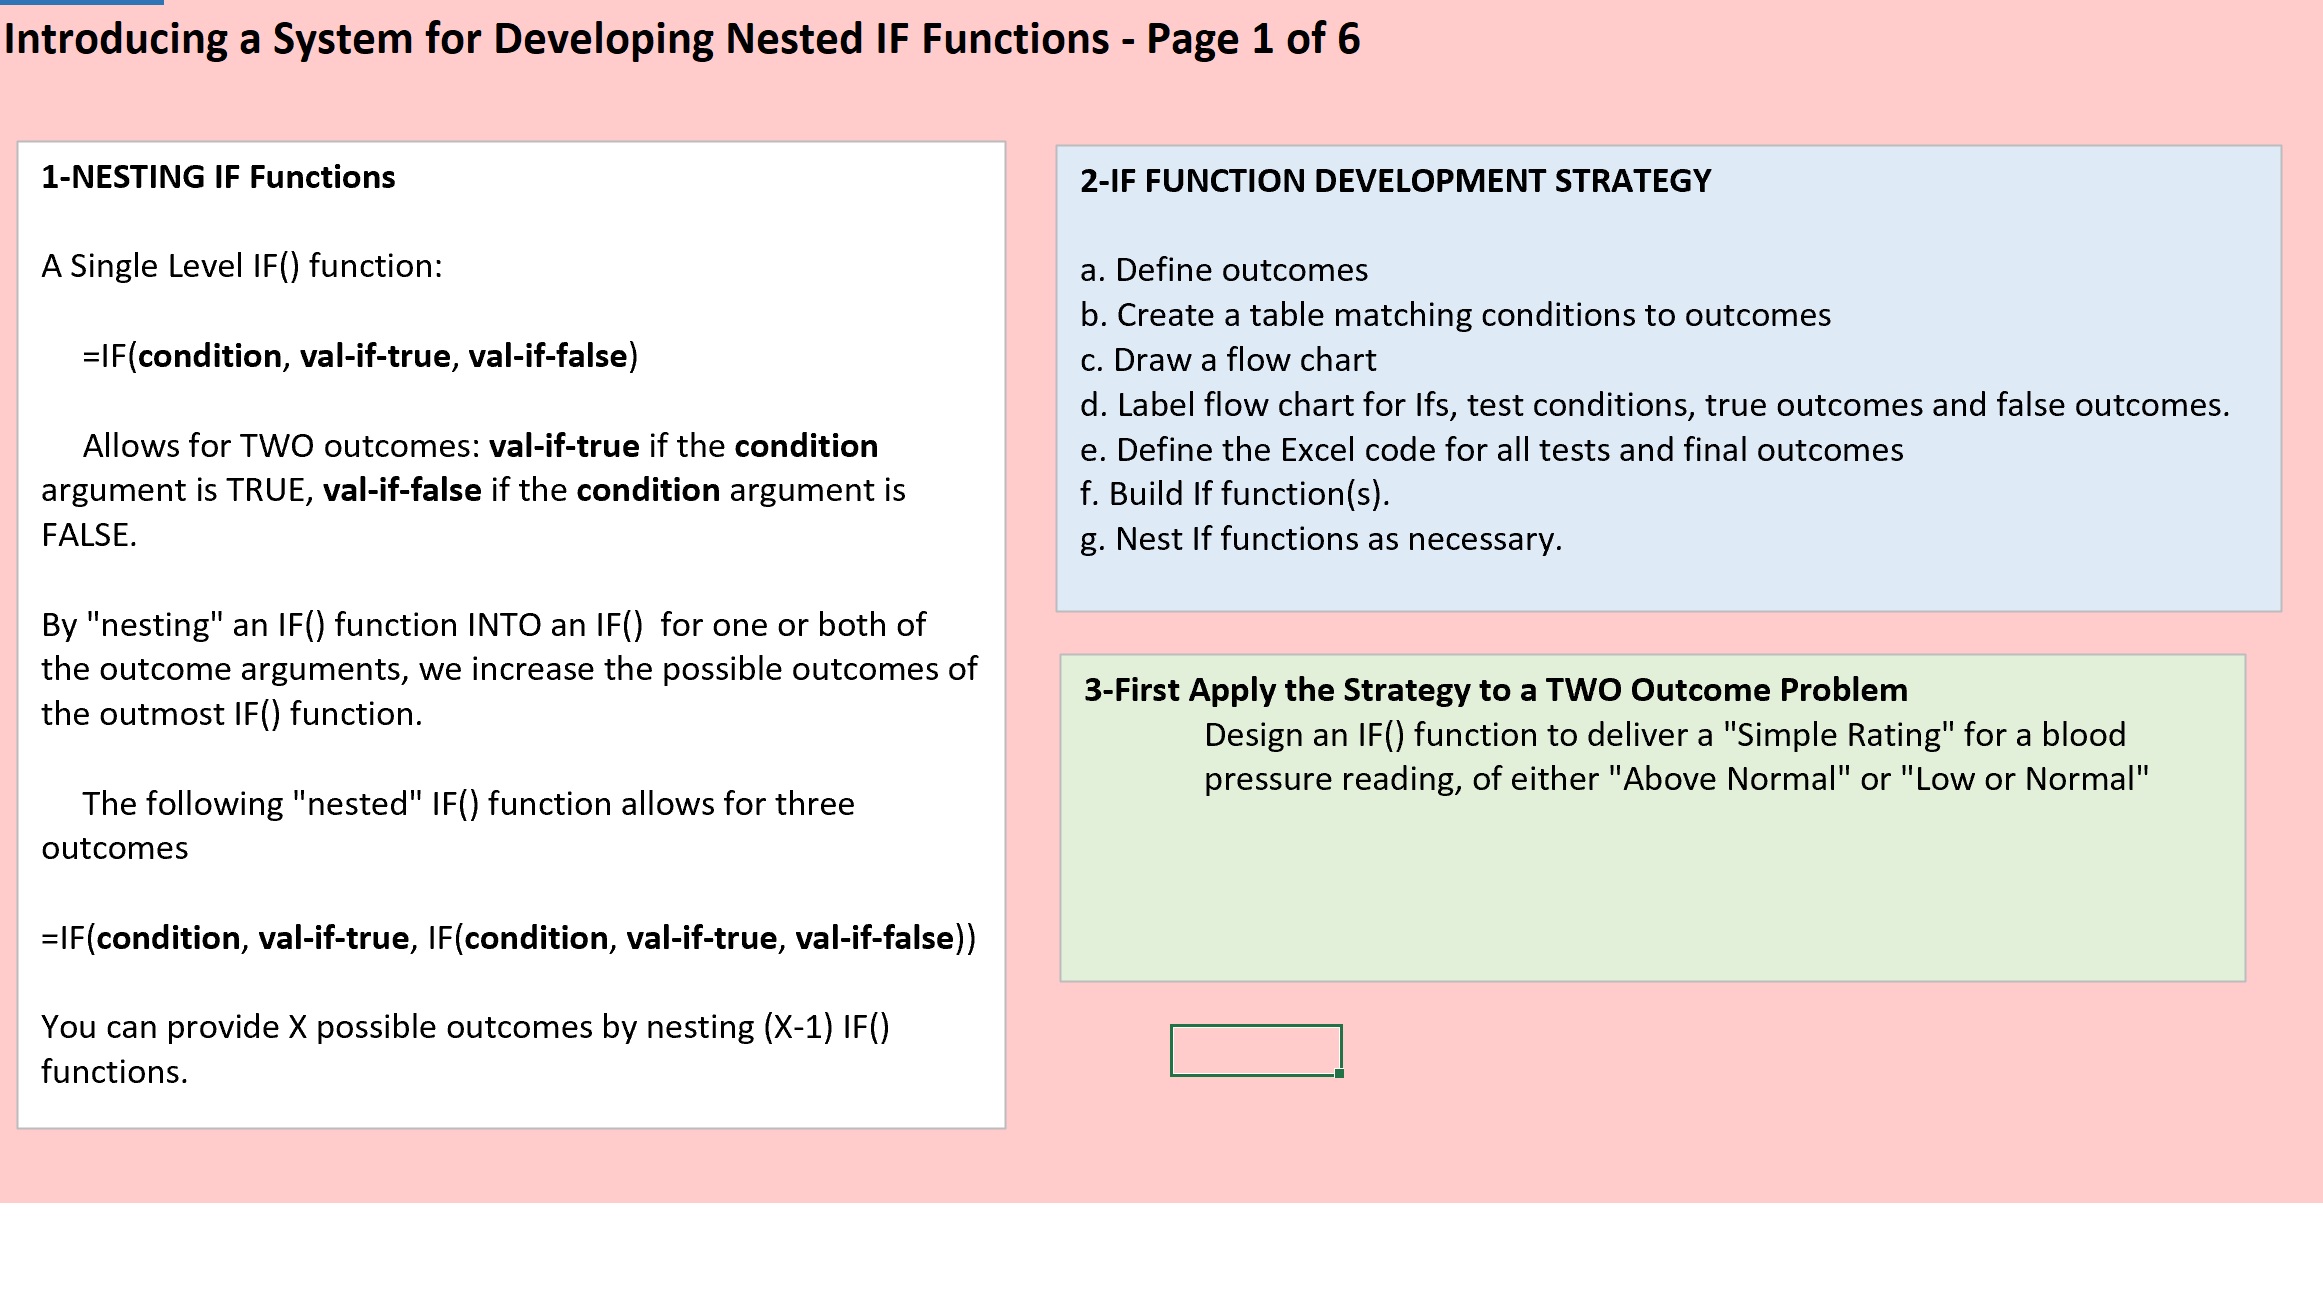
To begin talking about nesting IF() Functions, first we’re going to look at the structure of a single level IF()
Function. A single IF() Function has three arguments: the condition: the Logical Test,
then the value, the final value of the IF() Function, if that test evaluates to TRUE, and the final value of
the IF() Function if this test evaluates to FALSE. A single level IF() Function allows for two different
outcomes: Value_If_True, Value_If_False. Well, when you nest an IF() Function into an IF() Function, you
put it in as the Value_If_True or Value_If_False argument. So in this example Illustrated here,
if a second If() Function is nested in place of the Value_If_False argument,
to be executed in the case that the condition evaluates to FALSE, then we’re adding two additional
outcomes: we’ve got the Value_If_True from the first IF() Function, and then the Value_If_True or the
Value_If_False from the second IF() Function. So basically, you can provide X possible outcomes by
nesting X – (minus) 1 IF() Functions. We have 2 IF() functions nested together here, providing 3 different
outcomes: the Value_If_True in the first IF() Function and the Value_If_True or Value_If_False in the
second IF() Function.
This blue box here outlines a development strategy for a Nested IF() Function: a. Define all the possible
outcomes, then b. create a table matching the outcomes to the conditions necessary for them, then c.
draw a flow chart, then d. label the flow chart for the IFs, the test conditions, the TRUE outcomes and
the FALSE outcomes, then e. Define the Excel code for the tests and the outcomes, then f. build the IF()
Functions, g. nesting them as necessary. So first, we’re going to just apply this strategy to a 2 outcome
problem, and we’re going to design an IF() Function to deliver a SIMPLE rating for a blood pressure
reading: it’s either going to be “Above Normal” or “Low or Normal.”
So, the next step in this will be to to carry out a. defining the outcomes: “Above Normal” or “Low or
Normal” and then b. a table with the conditions says “blood pressure is >= (greater than or equal to) the
lowest value in the Pre-Hypertension Stage” that would give us an “Above Normal” outcome, OR “Blood
pressure is < (less than) the lowest value in the Pre-Hypertension Stage.” That would give us the “Low or
Normal” outcome.
c. Drawing flow charts doesn’t seem particularly necessary when you just have two outcomes, but it can
really help you think through the logistics of your more complex set of IF() Functions when you end up
with multiple different outcomes, and different tests to get to those outcomes. So I highly recommend
getting comfortable with using a flow chart. We use the diamond symbol for a logical test, and we use
rectangles for final outcomes, and this oval starts us off. You can also use an oval to end your flow path.
So in this case with just our two different outcomes we’re choosing to have our Logical Test be: if the
Blood Pressure is >= (greater than or equal to) the Lowest Pre-Hypertension Value, then that’s the test. If
that evaluates to TRUE then our outcome is going to be “Above Normal.” If that evaluates to FALSE, our
outcome is going to be “Low or Normal.” And I made a note here to remind all of us that whenever you
have only 2 possible outcomes, you only need 1 test, because if the test for one outcome is FALSE, then
the CORRECT outcome MUST be the one you DIDN’T test for. So in this case, we’re testing for the
“Above Normal” outcome and we end with that, if this test is TRUE. If this test is FALSE, then we know
our outcome is the “Low or Normal” outcome. We don’t have to test for that, because this one was
FALSE.
Now the next step in the strategy, d. we label our IF() Function elements into our flow chart. So the first
IF() (IF1), is up here labeled above this test, Test1 is the first argument in the first IF (IF1). True1 is the
second argument in the first IF(). And everything below the triangle (s/be “diamond” not “triangle”!) for
the test in the first IF() would be in the Value_if_False argument of the first IF(). In this case it’s just a
final outcome, but this would also be where you would start an IF() Function that you were going to nest
into your first IF(). So, we’ve just got three arguments here: Test1, True1, and False1. And we can make a
rudimentary IF() Function with those placeholders. If Test1 is TRUE, then True1, else False1. Now we
have to e. turn those arguments into Excel to finish our IF() function.
This illustrates finding the code for that test. If we look in the spreadsheet we see that we have the
Systolic reading in a particular cell, and that was I3 in this case. And we have to compare it to a value that
we’re defining as the “Above Normal” range, to do our test. And this is a picture of the table that has this
value named as “sys_above_normal.” So we’ve got the code for our test: is I3 >= (greater than or equal)
to sys_above_normal? And then our outcomes are simple text strings. If I3 is >= (greater than or equal
to) sys_above_normal then “Above Normal” is the outcome, else “Low or Normal” is the outcome. And
this was a simple single level IF() Function with only two outcomes, just using this to illustrate our
strategy before going on to a more complex example. Now let’s look at an IF() Function that would
provide for 5 different outcomes: we’ve got Stage Two Hypertension, Stage One Hypertension, Pre-
hypertension, Normal, and Low. And this is our step two (b.) of our strategy: we’re going to define the
conditions necessary to achieve the outcomes for Stage Two Hypertension. The blood pressure would
have to be >= (greater than or equal to) the lowest value in Stage Two. For Stage One Hypertension:
blood pressure would have to be >= (greater than or equal to) the lowest value in Stage One and < (less
than) Stage Two, and so on. I don’t need to read all of these to you, but you can look at them for
yourself, and see they make sense. At the very bottom, the conditions necessary for the “Low” outcome
would be >= (greater than or equal to) the lowest value in the Low region and < (less than) the lowest
value in the Normal region.
So now we go on to c. building the flow chart. And this is a much longer flow chart, because we’ve got
the first IF() (IF1) testing if blood pressure is >= (greater than or equal to) Stage Two. If that’s TRUE, then
we’re finished. If it’s FALSE, we don’t have to test is blood pressure < (less than) Stage Two because it
MUST be or we wouldn’t get to the second IF() Function (IF2). But we see that this whole False section,
resulting from a FALSE for the first test (Test1) is going to be IF() number two (IF2).
In IF() number two (IF2) we’re testing: is blood pressure >= (greater than or equal to) the lowest Stage
One? If that’s TRUE, then we finish: our final outcome is Stage One Hypertension. And I’m going to scroll
down to show the bottom of this flow chart.
The flow chart gets down to a fourth IF() Function (IF4) that tests: is blood pressure >= (greater than or
equal to) the lowest Normal? If that’s TRUE then the outcome is “Normal” else the outcome is “Low.”
e. And, in this table, we’ve defined tests and final outcomes with their Excel syntax, as we’ve named
these different ranges in the blood pressure tables. Let’s look at that in the blood pressure table.
This is named “dias_above_normal.” This is named “dia_low_stg1”, “dia_low_stg2.” Over here in the
Systolic table array we’ve got “sys_low_ normal,” “sys_above_normal,” “sys_low_stg1,” “sys_low_stg2.”
So when we define our Excel for this, the tests we have, we’re just, this illustration is using the Systolic
range to get that rating for the Systolic pressure. If I3 is >= (greater than or equal to) sys_ low_stg2, then
we know we’re at Stage Two Hypertension. If it’s >= (greater than or equal to) low_stg1,
I think that
there’s a text error here: this should be Stage 1 Hypertension, not 2.
This should be Stage 1 Hypertension. I apologize for that. If it’s >= (greater than or equal to) above
normal, it’s in the Pre-Hypertension Stage. If it’s >= (greater or equal to) Sys_low_normal, it’s in Normal,
else it’s in Low and these are the values for these different elements that we need for our IF() Function.
But now, when we actually build the IF() Function,
we can first just put it in terms of the generic Test1, True1, here’s our second IF(): Test2, True2, third IF()
has Test3, True3.
The fourth IF() (IF4): Test4, True4, False4. But now, when we actually build it out, we have the actual
code that we’ll be using to get our different outcomes.
And this is, I’ve also tried to label this to show you how the first IF() Function contains all of the others.
And we can scroll to the right to see this more clearly.
So at the end, that very first IF() Function has four parentheses at the end, because each of these IF()
Functions has to be closed that are within it.
So now we can go back to
the completed example and see here:
this is an IF() function with five different outcomes
for the Systolic blood pressure.
And we have the parallel to this for the Diastolic blood pressure. Thank you.