
If you haven’t already done so, I recommend you download this particular companion workbook, so that you can examine it and learn from it, and try functions on your own with it. So we’re going to jump to the worksheet labeled Nested If & Range Lookups.
And first thing, I want to just explain what we’re seeing here.
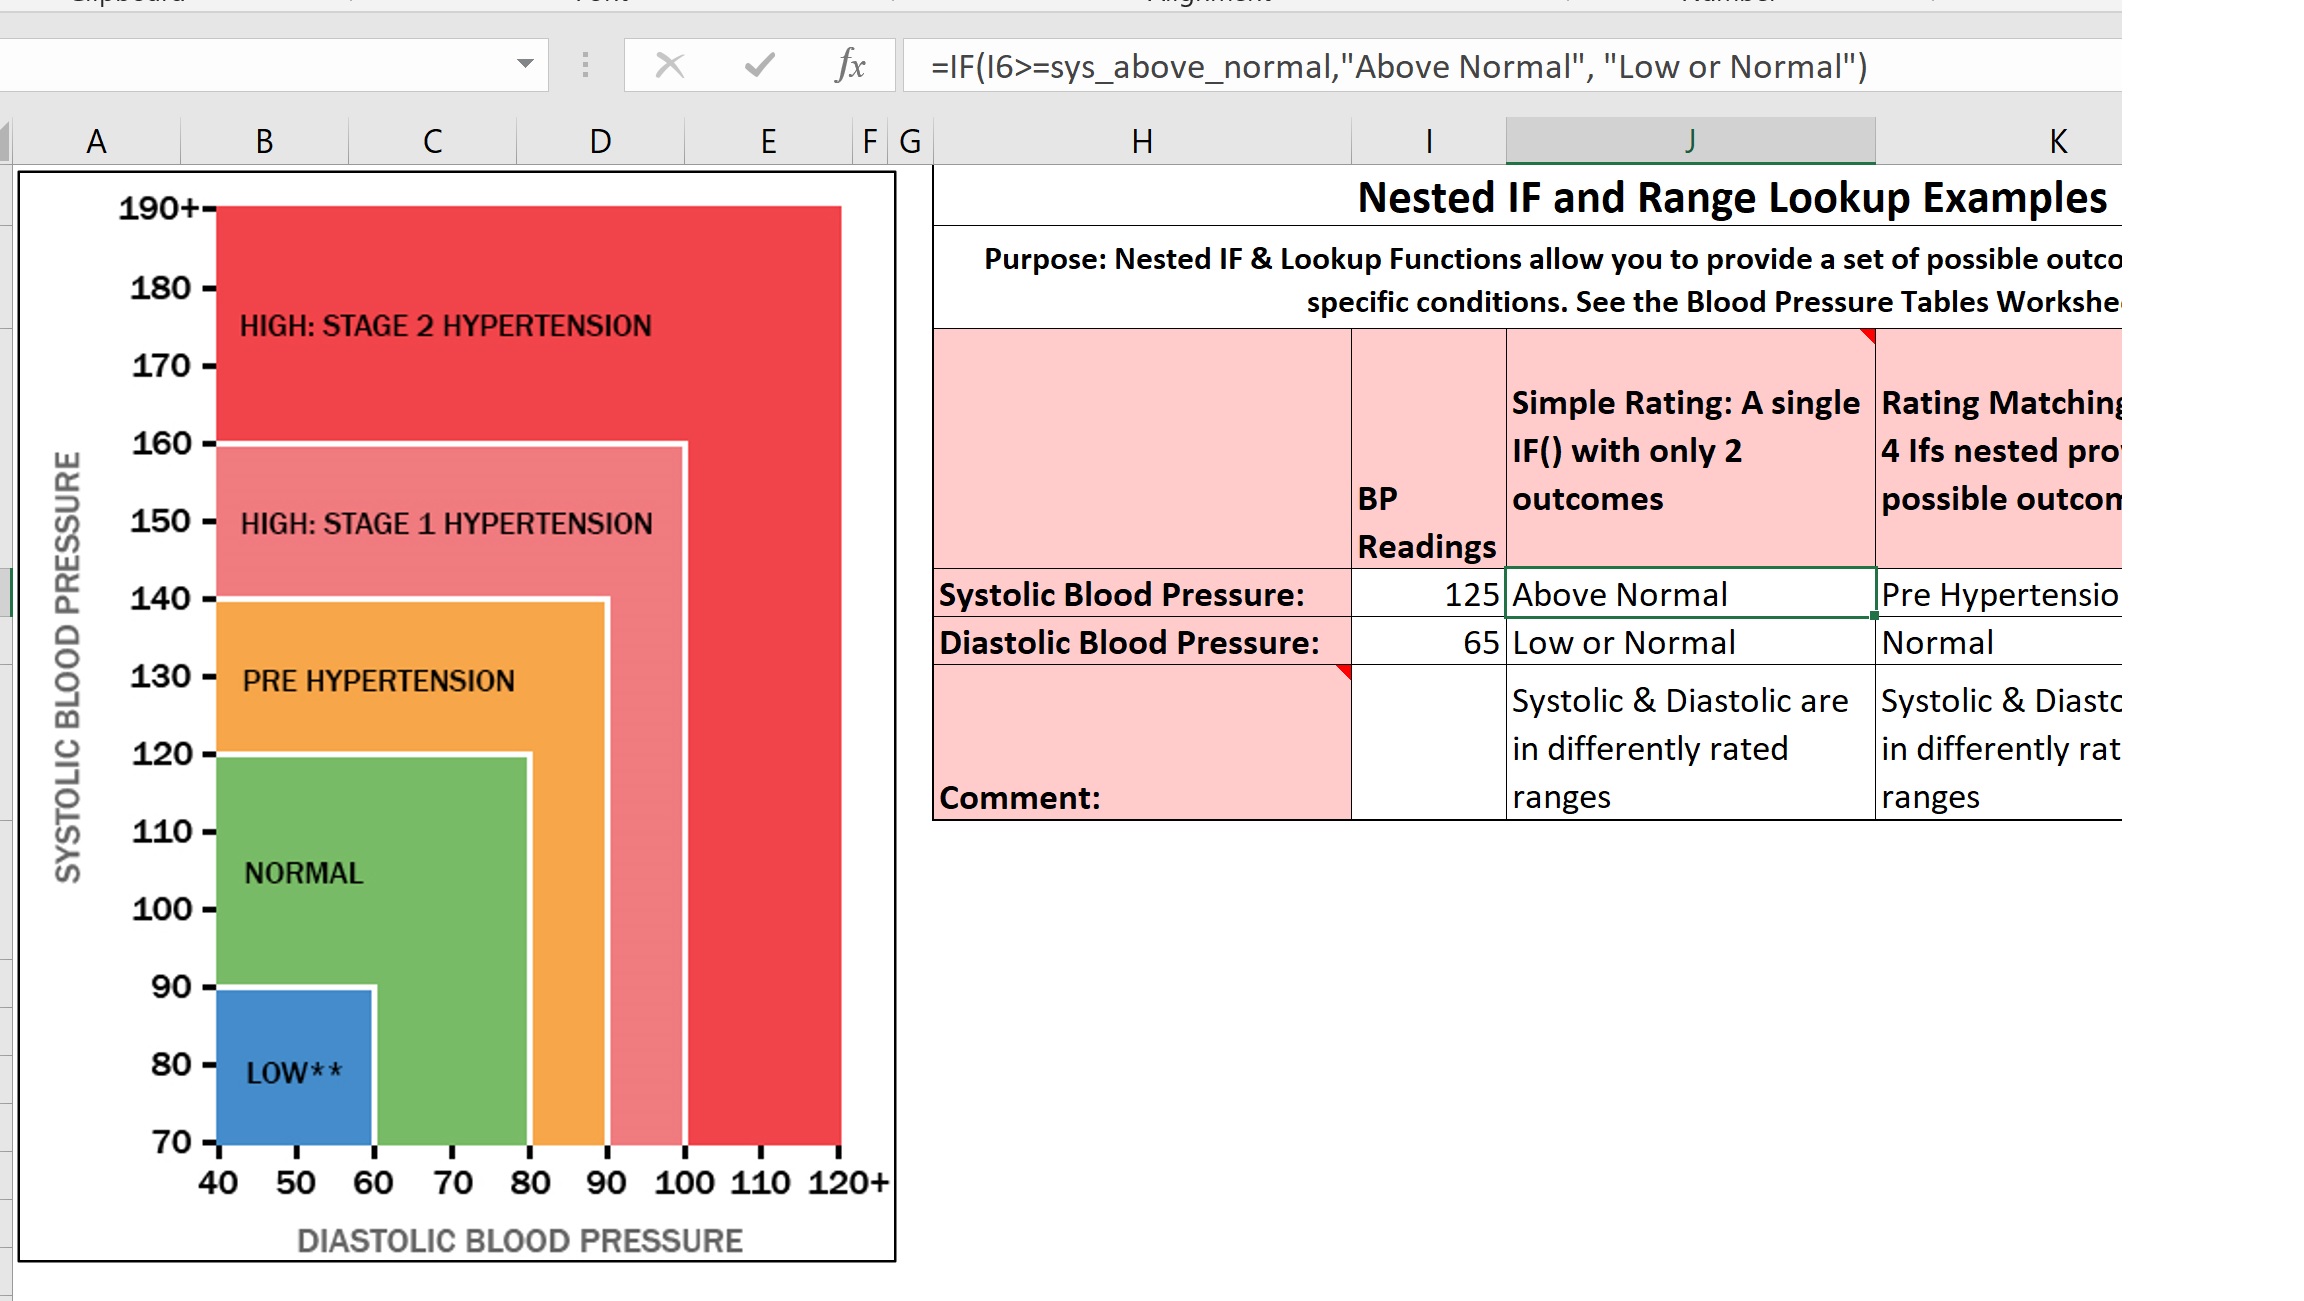
I’m trying to adjust the page so that you see everything that I want you to see. We’ve got
an illustration of stages of blood pressure readings, both Systolic blood pressure on the Y-axis and the Diastolic blood pressure on the X-axis. And the example we’re going to do here, we’re going to have an outcome to each of these blood pressure readings, the Systolic and the Diastolic, based on whether it’s either “Above Normal” or “Low Or Normal.” If it’s in the “Above Normal” range we’ll say it’s “Above Normal” and if it’s in the “Low” or “Normal” range we’ll say “Low or Normal.” We just, in this case, we’re doing an IF() Function, a single IF() Function, with only TWO outcomes. So looking at this illustration, the Systolic blood pressure is in the “Low or Normal” range if the reading, the Systolic reading, is less than 120. The lowest, the way we’re interpreting this picture is, the lowest Pre-Hypertension reading would be 120. And for the Diastolic blood pressure, we’re interpreting that to be “Low or Normal” if it’s below 80 in the Diastolic axis. So to implement that, we have on another worksheet, labeled Blood Pressure Tables, we’ve got the Systolic Table Array with the lowest value for the “Low” range is zero, the lowest value
for the “Normal” range is 90, the lowest value for the “Pre-Hypertension” is 120. And we’ve named that 120 in the Systolic table array: Sys_above_normal.
And we see that this Systolic Table Array is vertically organized. The lowest range in the top left corner and the highest range in the bottom left corner.
The Diastolic Table Array is arranged horizontally and the lowest value is in the top left corner, and the highest value is in the top right corner. And again, the lowest value in the “Pre-Hypertension” range, 80, is named DIAS_above_normal, so that we can use those named ranges in our IF() Function.
So, going back to the Nested If & Range examples, we’re going to look at our IF() Function with two outcomes. We see that we’re testing if I6, the Systolic blood pressure reading, is greater than or equal to Sys_above_normal, then our outcome is going to be “Above Normal” else our outcome is going to be “Low or Normal.”
For the Diastolic blood pressure reading, that’s in column I, cell I7, we have the same structure of an IF() Function: if I7 is greater than or equal to Dias_above_normal, and we know what that is, that’s 80, then we’re going to say that the Diastolic reading is “Above Normal” else we’ll say it’s “Low or Normal.”
So we just divided the blood pressure readings into either being in this Normal-Low range
for the first, for one of the outcomes, or Above Normal could be anything from Pre-Hypertension up to Stage Two Hypertension. And we see that in the case of the these two readings, the Systolic and the Diastolic, they’re in differently rated ranges, for this person’s blood pressure. Their Diastolic is lower, according to the chart, than their Systolic. And we’ve got another IF() Function here, that just tests whether or not these two RATINGS are the same. If J6 equals J7, then we, we say they’re in the “samely rated range” otherwise we say that they’re in “differently rated ranges.”
Thank you.