
Hello, this is Suzanne. Welcome to Excel Intuition. In this module we are introducing logical functions. If you haven’t already done so I recommend you pause this video and download your own copy of our companion file so you can follow along and also work the the challenge that set up to apply the functions to, once we’ve introduced them. So the logical functions that we’re going to look at in this module are the IF function, the AND function, and the OR function.
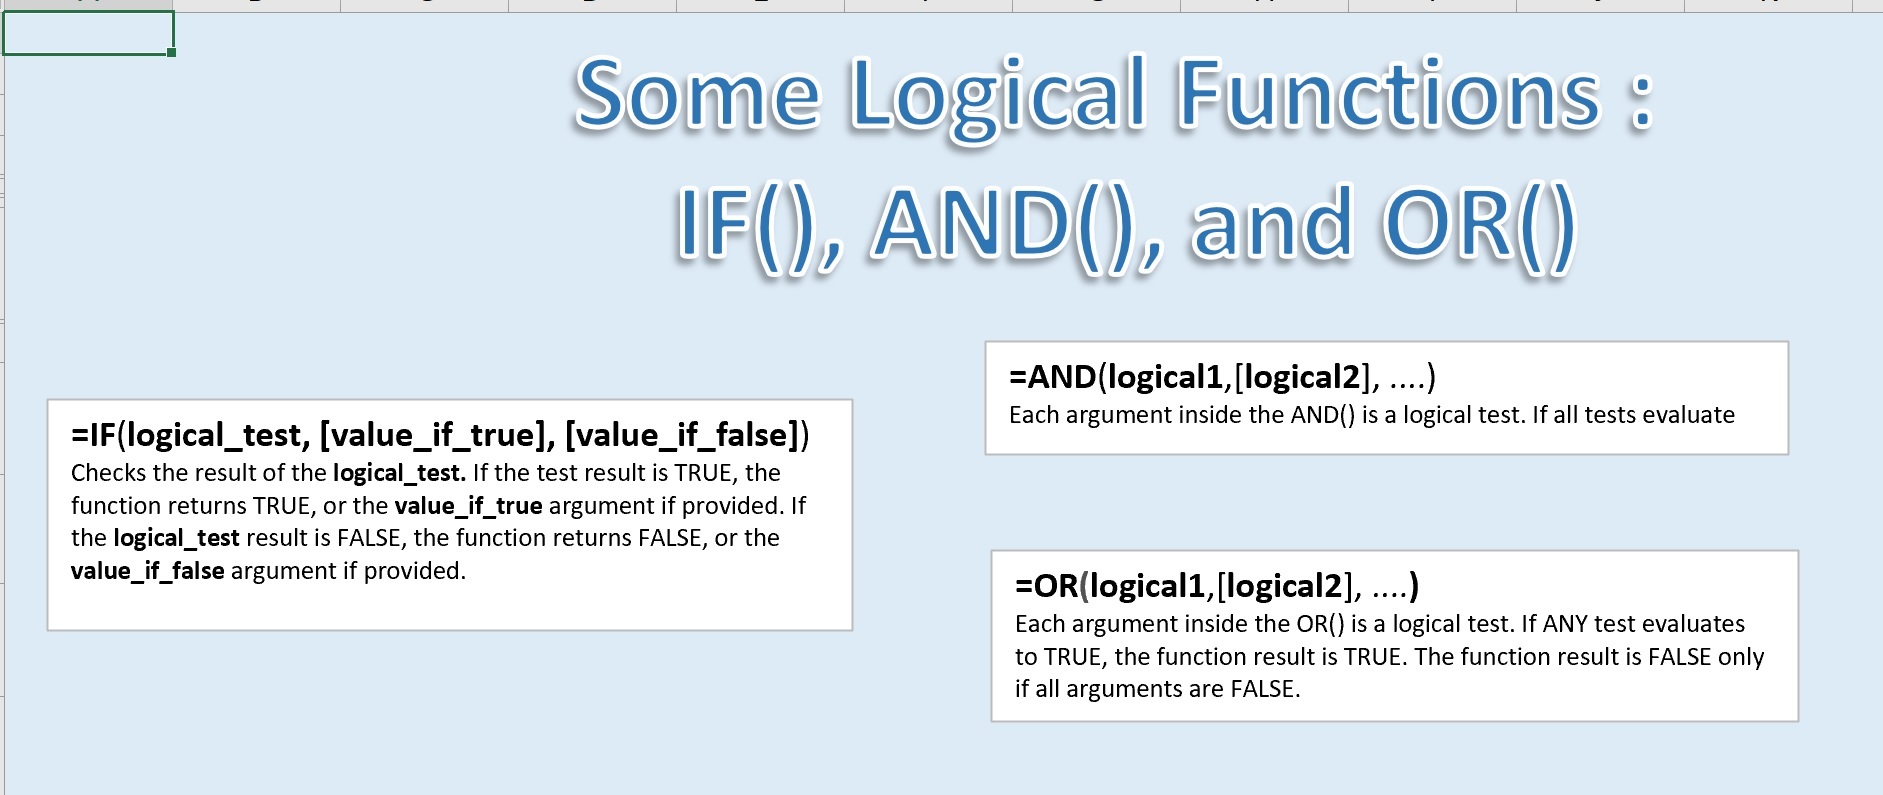
The IF function allows you to apply a logical test, basically saying x greater than or equal y type of a test, and if that logical test you’ve posed is true, you ask the IF function to return one specific value. If the logical test evaluates to false, you ask it to return a different value. These are both optional arguments, so if you don’t give it a value to return, it would just return the the logical value. So if the test was true and you didn’t give it a value_if_true argument, it would return true. If the test was false and you didn’t give it a value_if_false argument it would return false.
The AND function allows you to put many different logical tests all into the same… feed multiple logical tests to the same function, and if all of those tests evaluate true the and result is true. If any of them evaluate to false, the and will be false.
The OR function is similarly structured, you can put numerous logical tests into the parentheses of the function. You can give it many logical tests. I believe the total is, you could give it up to 255 tests. With the OR function, if any of those tests is true, the OR function will result in a true value. If all of them are false the OR will be false, but it will only be false if all of them are false.
So let’s look at an example using the IF function. We’re using some of the same data that we used in the lookup intro in our logical function intro. So here you have again the names of these cities and their sales tax rates being looked up, and this is the VLOOKUP function. Well we have two result rows here, and in one of them we’re using an if function to say if one of these cities has a greater sales tax than the other, you notice in this case Pacific Grove and Soledad have the same sales tax rate, so this result down here, it tells us if the tax rates are the same.
Let’s take a look at the functions that are in these cells in result 1. Note we’re saying, if B8, B8 is the sales tax rate for the city in column one, is greater than C8. That’s the logical test. If this sales tax rate is greater than this sales tax rate, then the value_if_true argument is a message that says B7, the city name in B7, has a higher sale sax rate than C7, the city in this column. Else the value_if_false will be a null message, just quote quote. So notice there is a null message in here because this rate is not greater than this rate. So it couldn’t say this city has a higher rate in this city.
Let’s change this to a different city. Now this is still a null message, because this rate isn’t greater than this rate, but in this case Greenfield is greater than Pacific Grove. So we have at the same IF function in this cell as this cell, except the test is the opposite. In this cell it tests, is this rate greater than this rate, instead of is this rate greater than this rate, and then it constructs the message from the opposite direction. So here we have a message: Greenfield has a higher sales tax rate than Pacific Grove.
Now if they’re the same, and I can’t remember what was in here to get it back to being the same, but let’s do this. Okay Monterey and Pacific Grove are the same, so now this message isn’t a null message, and lets look and see it what’s in this one. In this in this if function we’re asking the logical test is, is B8 equal to C8 and B8 is this sales tax rate, C8 is this one. If they’re both equal, if they’re the same, then we’re going to create a message that says the tax rates of the city in B7, and the city in C7 are the same. And you can see, you can play around with it, because you can change the cities and you could see how the messages work.
Now let’s look at AND and OR examples. In this case we’re looking up the persons in poverty percents for two different cities. And we’re using the AND function in these two cells, and using the OR function in these two cells. And what we’re testing, we are saying if, we’re looking to see, we want to compare the persons in poverty percents for these two cities in relation to the persons in poverty percent for the US as a whole.
So this column heading tells us what we’re testing for. It says both cities have lower percent than the US. That’s the statement we’re testing to find out if that’s true. Both cities have a lower percent than the US. And the tests that we put in there, we said B8 is less than F5. B8 is the percent for this first city. We’re testing is B8 less than F5, where the US percent is, and then is C8 less than F5. Those are our two logical tests. They’re inside an AND. The and is only going to be true if both of these tests are true. We can see just by looking ourselves that neither one of those is less than the US percent. They’re both greater. This AND would be false if only one of them was less, I mean if only one of them was greater than the US percent, but they’re both greater, so it’s going to be false either way.
Now we have this statement: both cities have a higher percent than the US, and we can see that that’s true, and we can see that our AND evaluated to true. And if we take a look at it, we see we have have the two tests. B8 greater than F5, C8 greater than F5, they’re both true, so the AND results in the true value.
Now we’re using the OR function, and remember only one of those tests has to be true for the OR to result in a true value. Here our statement, this is what we’re postulating: at least one city has a lower percent than the US. Turns out that’s false, neither city has a lower percent than the US, they’re both higher. And those tests are B8 less than F5, C8 less than F5. But it’s inside the OR function. So if either one was less, it would be true, but neither one is less, so it can’t be true.
And now we have at least one city has a higher percent than the US, and that’s true. We know that they both have a higher percent. But if just one of them did it would also be true.
We can play around with this and choose a different city, lets pick Gonzales, we know that one’s less than the US percent. So you can see how the ANDs and the ORs work with this example.
Now here’s a little report for you to work on on your own, if you want to pause the video and examine this, then see what you come up with. And then come back to this and we’ll work it together.
So what this report does is it brings information in here from the city demographics table. And what we’re looking at here is, we’re looking at given the median household income and the median value of owner occupied housing units, we just want to do a what if, little what if report here. If we make some assumptions that a person who wanted to buy a home would put down a certain percent, they would finance it for a certain number of years. We’re assuming putting down 20% on the home, financing it for 30 years, having an interest rate of 7%, paying monthly. We’ve got a median annual property tax for california, and the median annual property tax for the US. We’ve got an average monthly cost of home insurance for california and then the average monthly cost of home insurance for the US as a whole. And then we’re also postulating that one wouldn’t want to spend more than 25% of one’s monthly income on housing. That’s just based on some advice. And i’ve got links to the different websites that information is coming from. But we’re just setting up this little what if scenario here.
So we’ve got three different locations, the United States as a whole, and then different cities in monterey county. And again you can use the drop down to pick a different city for either of these rows. Right now we’ve got Salinas and Soledad. We’re bringing in the median value of owner occupied housing using just a pointer to the value for the US, but then for the different cities we’re looking them up from the city demographics table with an HLOOKUP. Then we’re calculating the amount to finance by subtracting 20%, assuming a down payment. And then we’re getting a monthly housing expense for purchasing a home. We’re making a number of assumptions. We’ve got a calculation here that uses a payment function to get a mortgage payment, and then it divides the property tax by twelve to get a monthly value, and adds in home insurance to come up with a theoretical monthly expense for paying to purchase your own home. We’ve got the US as a whole and then the two different cities that are selected.
Then we are looking up the median gross monthly rent for the us as a whole or for each of these different cities. And then we’ve also looked up, we’ve got the median household income that we looked up over here in column C, but we’re multiplying it by the this percent here that we’re saying is the max percent. I just linked to a website that information came from by clicking on that cell. Anyway, this percent link takes you to the website that has that budget guidance that came up with that percentage for housing.
Anyway this calculation here is that annual income multiplied by this 25% and then divided by 12 to get a monthly value. So the big question we’re asking here is, can you afford, with this median household income can you afford to purchase a median value home in the US as a whole with the median household income or in these different cities. So what would tell us? If our income available for the month is greater than or equal to the amount it would cost us to pay monthly to be purchasing a home, then we can afford it, otherwise we can’t. So the instructions here say insert an IF function that results in values of yes or no related to comparing the median monthly income available for housing and the monthly cost to purchase a median priced home. So we’re going to type: IF… the logical test is income available for housing greater than or equal to the monthly housing expense to own a home. If it’s greater than or equal, then yes, the median income would allow you to afford to purchase a median value home. Otherwise no, it wouldn’t. And we can drag this formula down the column, and we can see that in none of these cases would your median income theoretically be enough to purchase a home, a median priced home.
Now would your median income allow you to afford the monthly rent? Insert an IF function that results in the values of yes or no related to comparing medium monthly income available for housing and the median gross monthly rent for housing. So it’s basically the same test. We start with the income available for housing then we ask is it greater than our equal to the rent value. If it is then we say yes, otherwise we say no. It looks like in the US as a whole we can afford to rent, and in Soledad we can afford to rent, but in Salinas the mediam rental and the median income, it’s a little bit challenging. And we can pick different cities and explore.
So now we have a chance to use the AND and the OR function. With the AND we want to test, does our median income available for housing allow us to choose between buying and renting? Can we afford both of them? Would either one be an option for us? So basically we want to say: is the income available for housing greater than the cost to purchase per month, and is it also greater than the rental per month. We want to test both of those things. So we’re going to put income available for housing greater than or equal to monthly housing expense to own a house, and income available for housing greater than or equal to the monthly gross rent. We can see that we aren’t surprised, because we already know that according to this structure that’s been set up here, we can’t afford to buy a house in any of these three places with the median level of household income, and only planning to spend twenty five percent of it on the home. Now we’re going to test: is either of those things true for both. Is it true that the income available for housing is greater than the cars per month to own a home, or is the income available for housing greater than, actually i want to say greater than our equal not just greater than, is it greater or equal to the rent, the cost to rent. If either of those is true… and we knew that was what we were going to get.
So let me just say, I think probably many people who do afford to purchase a home are spending more than twenty five percent of their income on that expense, but the twenty five percent is out there because, it’s recommended that you not have to spend more than that much of your income on housing. So I just thought it would be interesting to take a look if we had median values for a household income and for the costs of owner occupied housing, would it look like your person in the median range could really afford the housing. And it’s a little bit discouraging actually.
So that is the end of this introduction to logical functions please do send messages if you have questions, if you’d like to request further examples, or if you have any suggestions they’re welcome. Thank you very much!